The Computer section acts as a central hub, offering a clear view of your system's configuration. You'll also find details about your computer's network identity, current clock speeds, power usage, and even real-time sensor readings. In short, it provides a comprehensive snapshot of your entire system's health and performance.
Summary
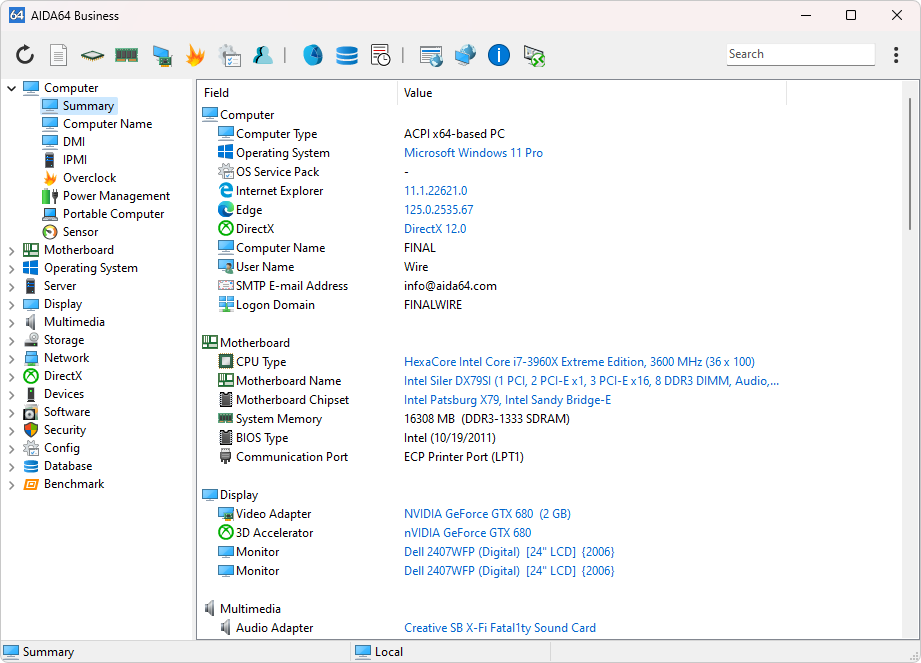
The Summary page lists the main hardware and software components of the given PC. We can select the individual items we would like to see here and add custom variables to the page in Preferences / Summary. We can also add custom components to the Summary page in Preferences / Custom Components and custom variables in Preferences / Summary.
Clicking on the items highlighted in blue on the page will open a context menu which provides links to the manufacturer's product information page as well as to BIOS and driver download websites.
Computer name
The Windows host name, the NetBIOS name as well as the DNS host and domain names of the PC are listed here.
DMI
Get a human-friendly breakdown of your computer's hardware components like BIOS, motherboard, and processors.
Note: DMI data may be incomplete or inaccurate due to manufacturer limitations.
IPMI
(For compatible systems) Access detailed IPMI system logs and sensor information.
Overclock
View detailed information for overclocking enthusiasts, including CPU properties, speeds, cache details, and motherboard/chipset/BIOS/graphics card data.
Power Management
Monitor your power source and battery (if applicable).
HID-capable UPS devices provide real-time data on temperature, capacity, voltage, current, and energy consumption.
Portable computer
(For laptops) Get specific physical details and Intel Centrino platform compliance information.
Sensor
Monitor System Health in Real-Time. The Sensor page provides a critical overview of your system's health through real-time monitoring of various sensors. This includes:
- Motherboard Sensors: Track vital motherboard components like chipset temperature, voltage levels, and fan speeds.
- CPU Sensors: Monitor CPU temperature, core clock speeds, fan speed, and voltage for efficient thermal management and performance optimization.
- HDD Sensors: Keep an eye on your hard drive's health with temperature, read/write speeds, and seek times. Early detection of potential issues can help prevent data loss.
- Cooling Fan RPM: Monitor the RPM of your cooling fans to ensure optimal airflow and prevent overheating.
- Voltage and Power: Track voltage levels for various components and overall power consumption to identify potential power supply issues or optimize energy efficiency.
Interpreting Sensor Data:
The specific sensor readings and their ideal ranges may vary depending on your hardware configuration. It's recommended to:
- Consult your motherboard/component manuals: This will provide information on normal operating ranges for specific sensor readings.
- Research online resources: Websites and forums dedicated to hardware and overclocking can offer valuable insights and benchmarks.
- Set custom alerts: AIDA64 allows you to set up alerts for sensor readings that exceed predefined thresholds, notifying you of potential issues before they escalate.