
To access the SensorPanel Manager, launch AIDA64, open Preferences, and navigate to the SensorPanel page under Hardware Monitoring. Enable the SensorPanel feature. Once the panel appears, you can open SensorPanel Manager by right-clicking on the panel and selecting it from the popup menu.
The SensorPanel Manager is an essential part of AIDA64 for customizing and managing your SensorPanel display. It allows users to design and organize a unique monitoring dashboard tailored to their preferences and requirements.
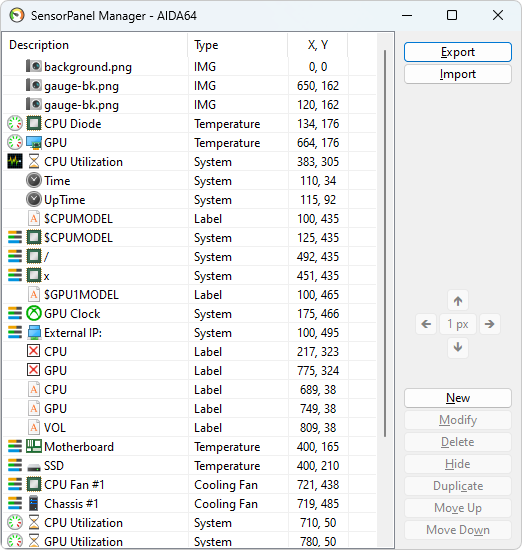
With the SensorPanel Manager, you can add, remove, and customize various elements such as graphs, gauges, bar indicators, and textual information to display vital hardware statistics like temperatures, fan speeds, voltages, and more. The intuitive drag-and-drop interface makes it easy to position and resize these elements, ensuring your panel looks exactly how you want it.
Additionally, the SensorPanel Manager offers various styling options, including different fonts, colors, and backgrounds, allowing for a personalized touch. Whether you prefer a minimalist look or a detailed, data-rich display, the SensorPanel Manager provides the tools you need to create a perfect monitoring setup.
By clicking "Export," you can save your customized SensorPanel to a file with the extension .SENSORPANEL. This file contains all graphics and settings used in the panel, making it easy to share your SensorPanel with friends. They can start using it by pressing the "Import" button. You can also import SensorPanel files created by others. Many different panels can be found in the AIDA64 discussion forum, created by the broad AIDA64 community. Dedicated topics for SensorPanel can be found in the AIDA64 Discussion Forum.