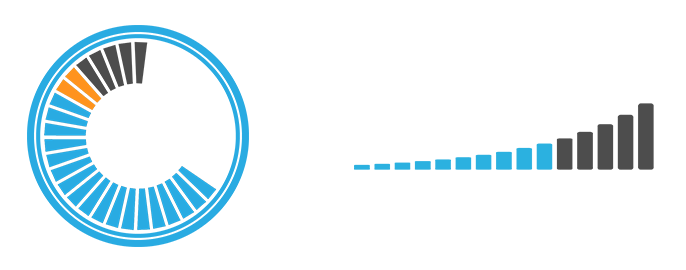
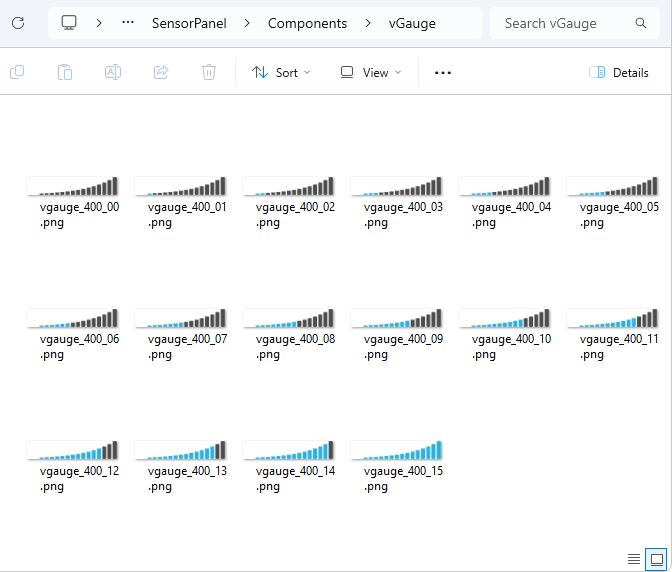
With SensorPanel, you can go beyond custom layouts and sensor items—you can also customize its gauges. This allows you to create almost anything by designing up to 16 individual states and assigning these images to a custom gauge on your panel. You can define a min/max range to suit your needs, making the gauge highly flexible.
Plan Your Gauge Design: Decide on the visual style of your gauge states (e.g., a progress bar, a needle meter, or segmented states).

You need a Graphics Software: Use software like Photoshop, GIMP, or Canva. Create a new document sized appropriately for your gauge, such as 256x256 pixels, or you can create a larger size to support higher DPI monitors. You can set the size in SensorPanel Manager when inserting it to your panel.
Design Each State: Start with the lowest state (e.g., empty gauge or 0% progress).
Gradually add elements or adjust the design for each state to represent increasing levels (e.g., 10%, 20%, etc.).
Use layers to make adjustments easy.
Save Each State as an Image: Save each design as an individual file (e.g., state1.png, state2.png).
Use .png if transparency is needed; otherwise, .jpg works fine.

Ensure Uniformity: Keep the position, size, and style consistent across all 16 states to avoid visual misalignment in the gauge.
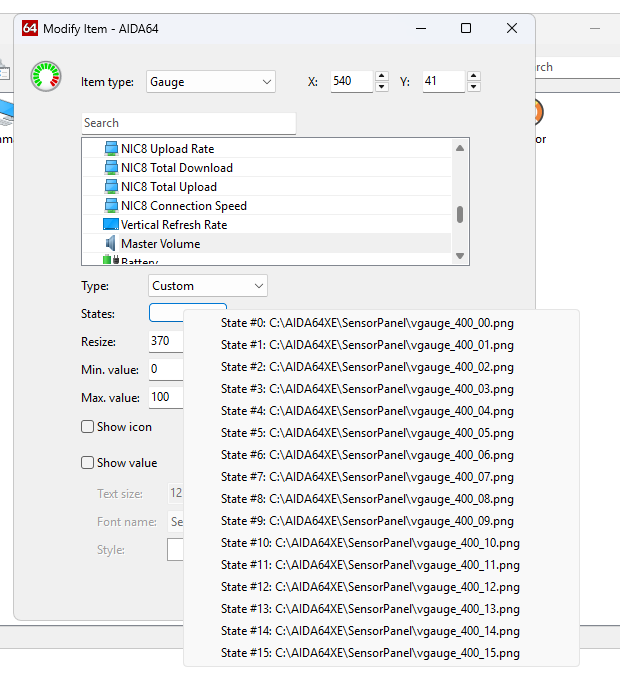
Assign to SensorPanel: Load the images into SensorPanel, map them to the corresponding gauge states, and set the min/max range for smooth transitions
.


